3.4: Statistics – Control charts and trends
Purpose and contents of a control chart
A control chart displays monitoring data for a given characteristic against either time or sample sequence number. It has the following important features clearly marked:
control limits;
each measured data point;
the mean value of the measurements.
Purpose of control limits
Control limits can be based on long-term monitoring data (including data from the reporting period). They are horizontal lines parallel to the mean but shifted from it by a number of standard deviations (at least 1.64 times the standard deviation), and they are calculated from the long-term standard deviation. They thus define the area within which most of the long-term data fall. Provided that the system is ‘in control’, most of the data for the reporting period will also lie between these limits. In addition, an alert limit can also be set, which is more stringent than the control limit. The alert limit is the point at which corrective action is initiated to avoid breaching a control limit.
Alternatively, the control limits can be set at some pre-determined target criteria or critical limits (see Sections 9.4.2 and 9.4.3). The target criteria reflect the effectiveness of a process. A critical limit is a prescribed tolerance that distinguishes acceptable from unacceptable performance.
Control charts can also be used to assess long-term performance on an ongoing basis (rather than for a given reporting period), in which case the control limits and mean should be calculated from all the available data over previous years, and recalculated periodically. They should be used in relation to operational monitoring data, but are of no use when assessing drinking water quality monitoring data.
Advantages of using control charts to assess performance
When using control charts to assess long-term operational performance:
It is easy to see if data exceed an alert limit (target criteria) or control limit (critical limit), and by what amount.
The variability in the data can be quickly determined. Characteristics with low variability may be of less concern than those that vary markedly. Trends or ‘runs’ of consecutive high or low values in the data may also be observable.
Setting control limits
A decision must be made on where to place the control limits; that is, on the percentage of the long-term measured data that they will contain (see Table IS3.4.1). It is suggested that the control limits should be not less than 1.64 times the long-term standard deviation; for normally distributed data, this will encompass approximately 90% of the long-term data and, provided the system remains in control, approximately 90% of the data for the reporting period. The distances for other percentages of the data are shown below. These figures are constants for any normal distribution curve, and can be determined from cumulative normal probability tables given in most statistical textbooks.
Alternatively, the control or alert limits can be set based on an operational target or limit that must be met, for example, the need to maintain a fluoride concentration below 1.0 mg/L. In this example, the upper control limit may be 0.8 mg/L and the alert limit 1.0 mg/L. By plotting the data on a control chart, emerging trends in fluoride concentrations can be identified, and preferably managed before either the control limit (critical limit) or alert limit (target criteria) is reached.
Table IS3.4.1 Relationship between control limits and multiples of the standard deviation ³
1.64 x s
90.00
1.96 x s
95.00
3.00 x s
99.85
³ Taylor JK (1987). Quality assurance of chemical measurements, Lewis Publishers, Chelsea, Michigan.
Determining the standard deviation
In order to establish control limits, it is necessary to determine a reliable mean and long-term standard deviation. To obtain initial estimates of these statistics, no less than 7 and preferably 15 or more measurements are required from independent representative samples. Therefore, a monthly sampling program would collect sufficient data to allow for meaningful control limits to be set after a 12-month period. It is clearly unsatisfactory to bias the results by selecting sampling times or locations that are favourable (or unfavourable).
To ensure the ongoing relevance of the control limits that are set, the mean and standard deviation should be periodically recalculated based on either a longer data set, or another representative period of collected data.
Example of a control chart
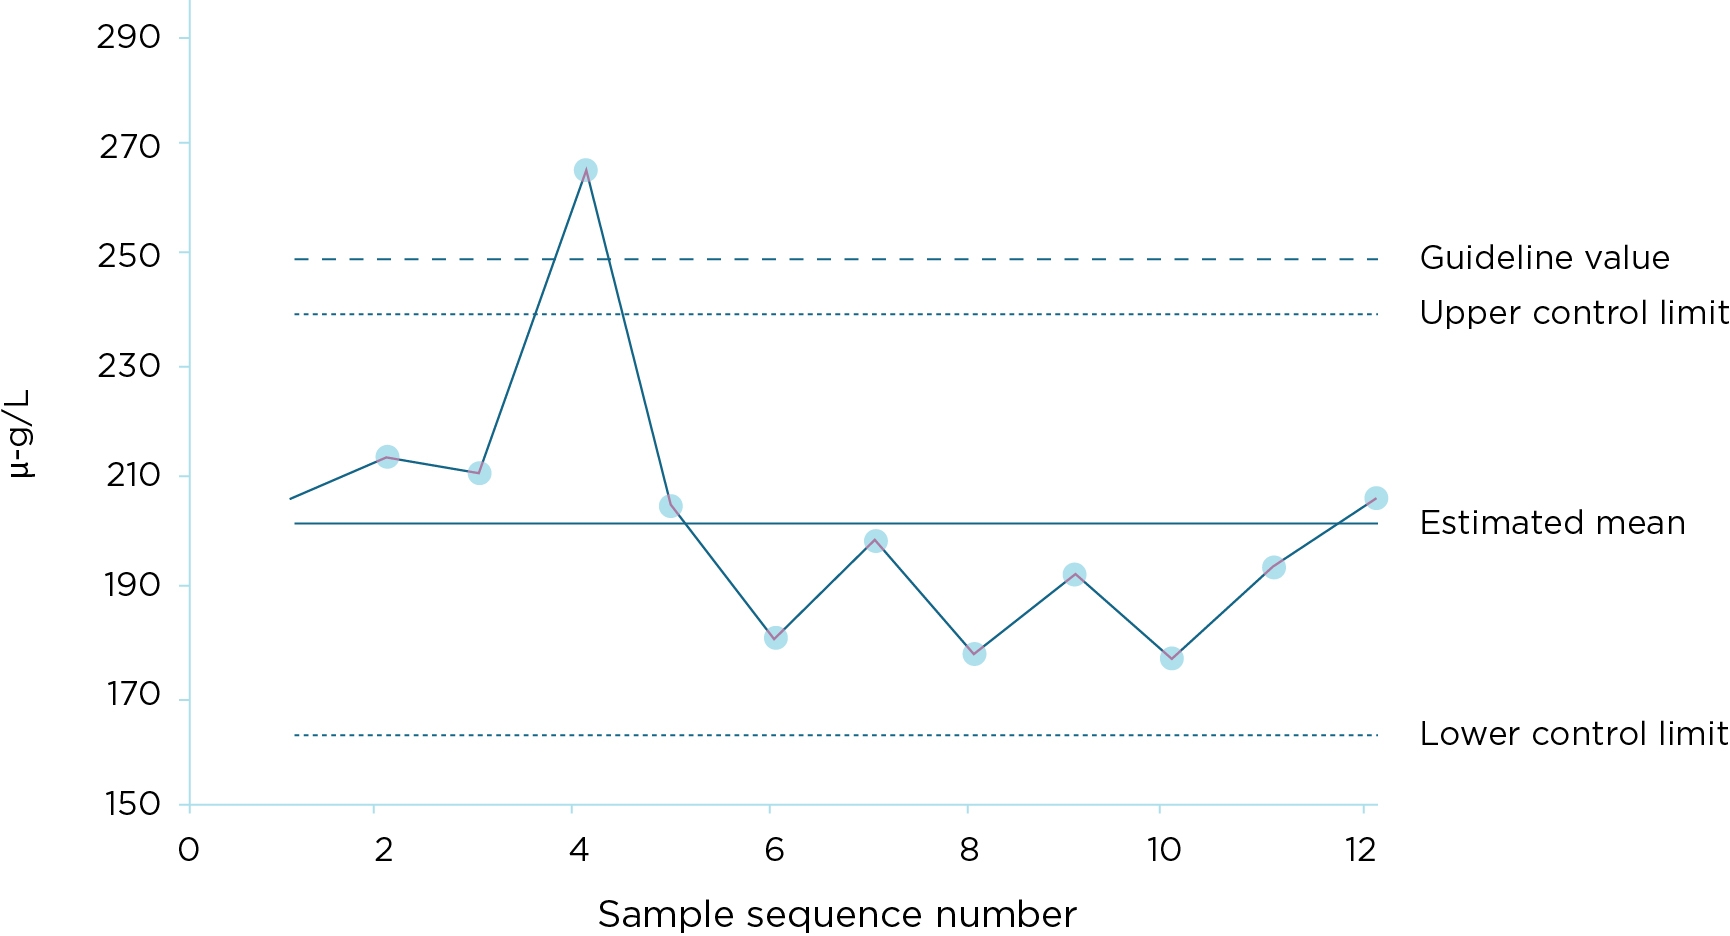
Figure IS3.4.1 shows an example of a control chart using trihalomethanes data, using 12 monthly measurements. In the example, the control limits have been placed at two standard deviations away from the mean. The guideline value would act as the critical limit. Excursions above either the control limit or the critical limit would prompt an investigation. The control chart shows that, except for the one excursion above the critical limit, trihalomethanes levels were generally under control during the period under review.
Figure IS3.4.1 Example of a control chart for trihalomethanes data

References
ANZECC, ARMCANZ (Australia and New Zealand Environment and Conservation Council, Agriculture and Resource Management Council of Australia and New Zealand) (2000). Australian Guidelines for Monitoring and Reporting. National Water Quality Management Strategy Paper no. 7. ANZECC, ARMCANZ.
APHA (American Public Health Association) (2005). Method 1010B General Introduction: Statistics. In: Standard Methods for the Examination of Water and Wastewater, 21st Edition. APHA, Washington, United States.
Taylor JK (1987). Quality Assurance of Chemical Measurements. Lewis Publishers, Chelsea, Michigan.