3.5: Number of samples required
Non-microbial
Poor quality water supplies should be more frequently monitored than good quality water supplies; this is supported by statistical arguments as shown below.
If the data are normally distributed, the minimum number of samples required to achieve a desired level of precision with a known degree of confidence can be determined using the following formula:
Where:
Most water quality data are skewed. Where the data are skewed, it is still possible to calculate the number of samples required but the calculation is more complex (Ellis 1989). Boxes IS3.5.1 to IS 3.5.3 detail this more complex method.
Samples required to meet a guideline based on a 95ᵗʰ percentile
Suppose that in the past a characteristic has been running with a mean of 0.02 mg/L with a standard deviation of 0.02 mg/L, and that for this characteristic the guideline value is 0.1 mg/L. The 95ᵗʰ percentile can be estimated as follows:
95ᵗʰ percentile = mean + 1.64 x s = 0.02 + 1.64 x 0.02 = 0.0528
This is well below the guideline value. It would be possible to take fewer samples and still be confident that the guideline has been met.
To estimate the minimum number of samples necessary, the first step is to calculate the necessary precision by halving the difference between the 95ᵗʰ percentile and the guideline value:
(0.1 - 0.0528)/2 = 0.0236 mg/L
The lower limit of the confidence interval is the estimated 95ᵗʰ percentile, and the upper limit is the guideline value. The number of samples required to achieve this can then be calculated as follows:
Thus, a precision of 0.0236 mg/L can be achieved (with 95% confidence) by taking 8 samples over the year. Alternatively, 8 samples per year will be sufficient to be sure (with 95% confidence), that the 95ᵗʰ percentile is less than the guideline value.
Samples required to meet guidelines based on 95ᵗʰ percentile, with a different mean
Suppose that after taking these 8 samples it is found that the mean has drifted up to 0.04 mg/L, but the standard deviation remains the same at 0.02 mg/L. The 95ᵗʰ percentile is now:
95ᵗʰ percentile = mean + 1.64 x s = 0.04 + 1.64 x 0.02 = 0.0728
The precision now required is 0.014 mg/L (as (0.1–0.072/2)=0.014 mg/L). This is a smaller value and hence the number of samples required to achieve it with the same degree of confidence will increase:
Therefore, the sampling frequency would have to be increased to 22 per year, or about 1 per fortnight, to meet this change in precision.
Number of samples based on meeting a mean
Using the same data given in Example 2 above, the precision required can be calculated by halving the difference between the mean and the guideline value, i.e. (0.100– 0.040)/2 = 0.03 mg/L (the lower limit of the confidence interval in this example is the mean, and the upper limit is the guideline value). The number of samples required is then:
Thus, 2 samples per year would be sufficient to be sure (with 95% confidence) that the mean is less than the guideline value. Using a mean instead of a 95ᵗʰ percentile can make a substantial difference to the number of samples required.
Microbial
One of the aims in any sampling program, particularly microbiological sampling, is to have a high degree of confidence that the water quality as measured in the laboratory is representative of that actually used by the consumer, not just at the time of sampling, but all the time. Unless all water is sampled, it is not possible to be 100% confident that this condition is met. A properly designed sampling program, testing only a very small percentage of the total amount of water in a system, can give a high degree of confidence about the overall water quality. The degree of confidence is related to the number of samples analysed. (This assumes, of course, that the sampling locations selected are representative of the water supplied to the consumer.)
Even if all samples tested are free of bacterial indicators, no sampling program can guarantee that all the water in a system is free of indicator organisms. In fact, it can be shown that for any reasonable sampling program, the degree of confidence in achieving a situation where 100% of the water in a system is free of bacterial contamination is close to zero (Ellis 1989).
It is far better to have a high degree of confidence that a large proportion of the water is free of contamination, than to have no confidence that all the water is uncontaminated. Realistic monitoring programs can give a high degree of confidence that 98% of all the water in a system is fee of bacterial contamination.
This does not mean that the other 2% of water is contaminated. All it indicates is that the sampling program is statistically unable to show a high degree of confidence that more than 98% of all the water in the system is free of contamination.
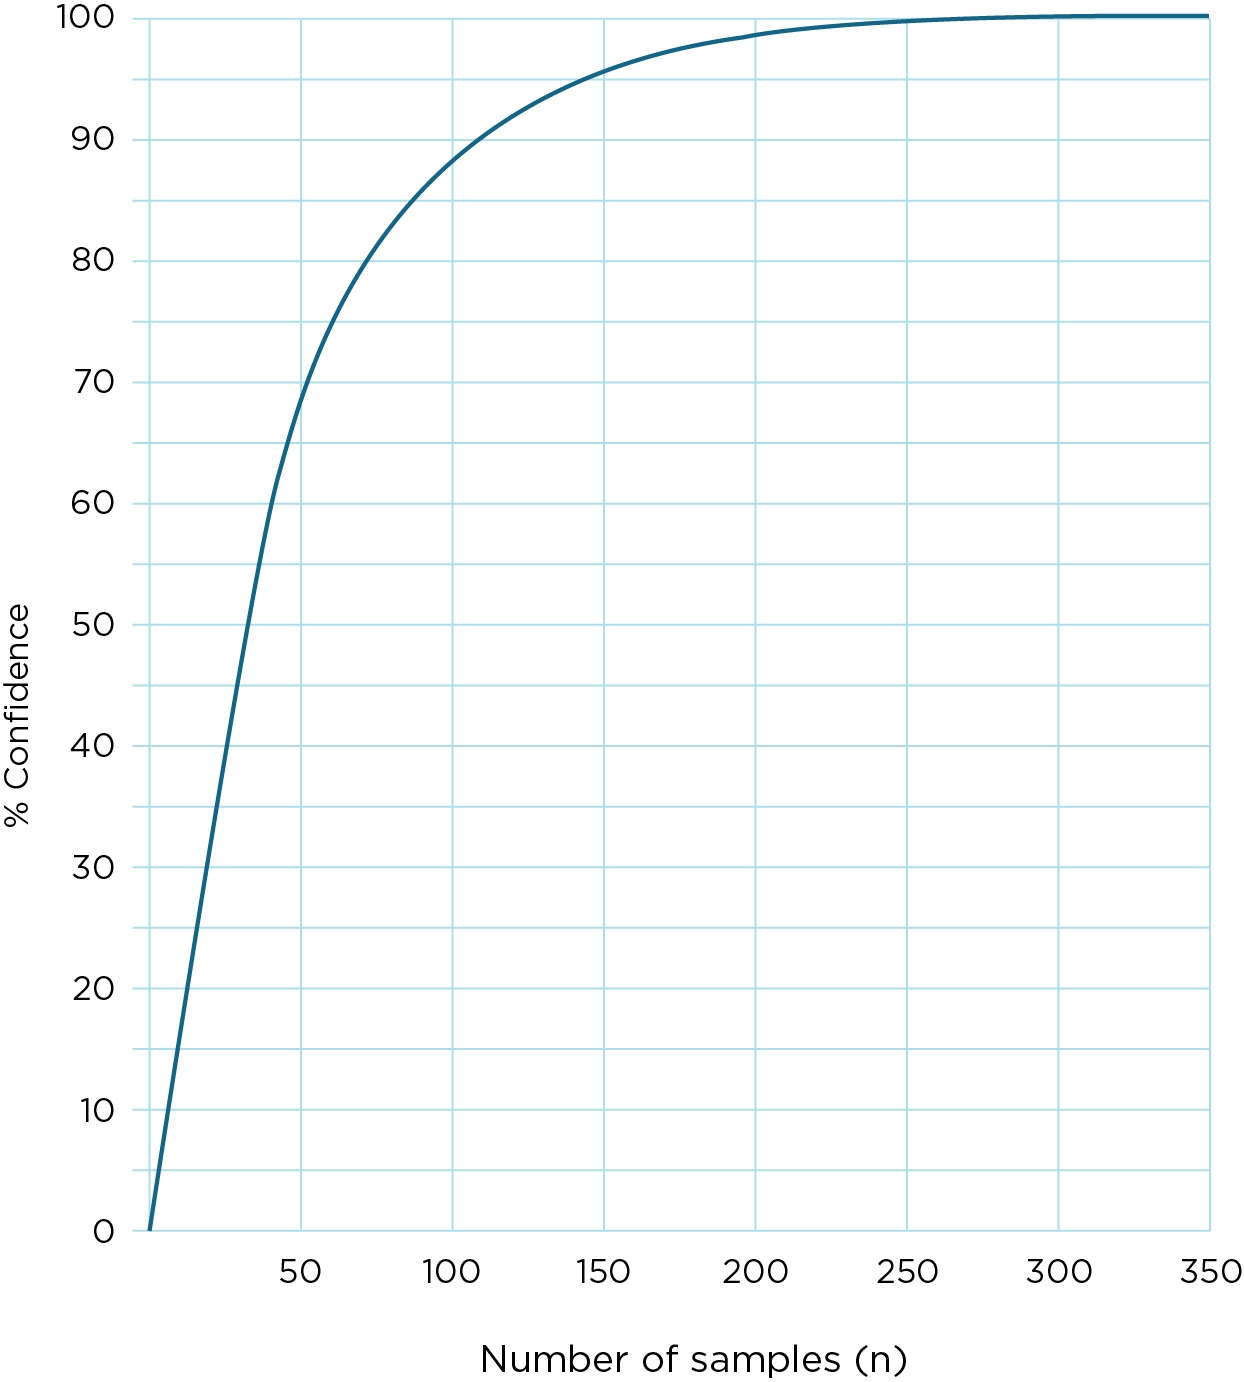
Even if all samples tested are uncontaminated, it does not follow that there is necessarily a high degree of confidence that the water is free from contamination. The number of samples required to meet a target, and the degree of confidence that this confers when all samples are free of contamination, is shown in Figure IS3.5.1 (Ellis 1989).
For example, if 50 samples are tested per year and all are free of contamination, then there is only 65% confidence that 98% of the water in the system is free of contamination. It would be necessary to take 150 samples, each free of contamination, before the degree of confidence reached 95%. Fewer than 50 samples per year, even if each sample was free of contamination, give a low degree of confidence that the water system as a whole is 98% free of contamination.
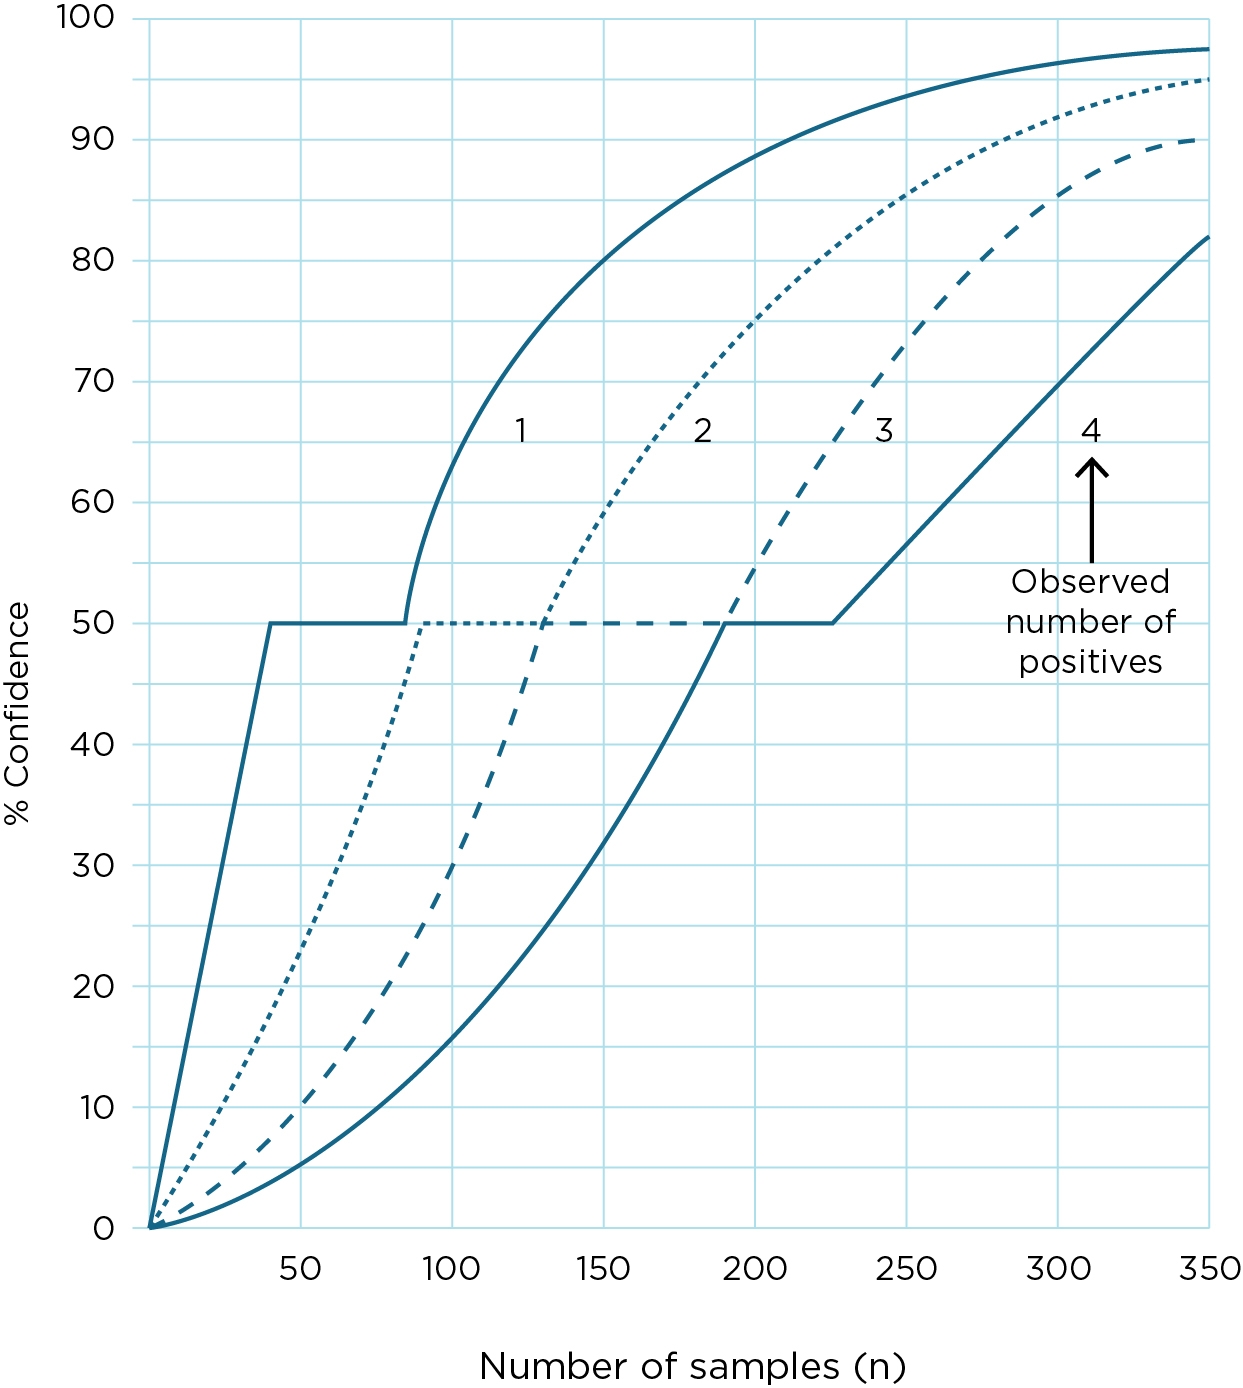
If one or more samples taken over a year are positive, then the degree of confidence that 98% of water in the system is free of contamination is reduced. This is shown in Figure IS3.3.2 (Ellis 1989). Suppose, for example, that 150 samples were collected in a year but some of those samples showed faecal contamination. The degree of confidence that 98% of the water in the system is free of contamination drops from 95% with a positive result to 80% with one positive result, and 60% with two positive results.
The plateau shown in Figure 2 at the 50% confidence level is an artefact of the difficult computation procedure used to derive these graphs. The graphs should only be regarded as an approximate guide, but they nevertheless provide a highly informative summary.
Figure IS3.5.1 Level of confidence that 98% of water in a supply is free of faecal contamination for different numbers of samples when all samples tested are free of faecal contamination (Source: Ellis 1989, reprinted with permission of the Water Research Centre, Medmenham)

Figure IS3.5.2 Level of confidence that 98% of water in a supply is free of faecal contamination for different numbers of samples when 1, 2, 3 or 4 samples give positive results (Source: Ellis 1989, reprinted with permission of the Water Research Centre, Medmenham)

Reference
Ellis JC (1989). Handbook on the Design and Interpretation of Monitoring Programmes. Water Research Centre, Medmenham, UK, Report NS No 29.